")


(*) Text and images courtesy of the Ultrasound Systems and Technology Group (GSTU) of the Institute of Physics and Information Technology (ITEFI-CSIC).
Basic concepts
The ultrasonic inspection technology in air at atmospheric pressure works without liquid or solid media between transducers and coupling piece. This technology includes transducers, electronics and digital processing algorithms SNR improvement. Figure 1 shows four possible inspection setups, and Figure 2 a typical experimental arrangement.
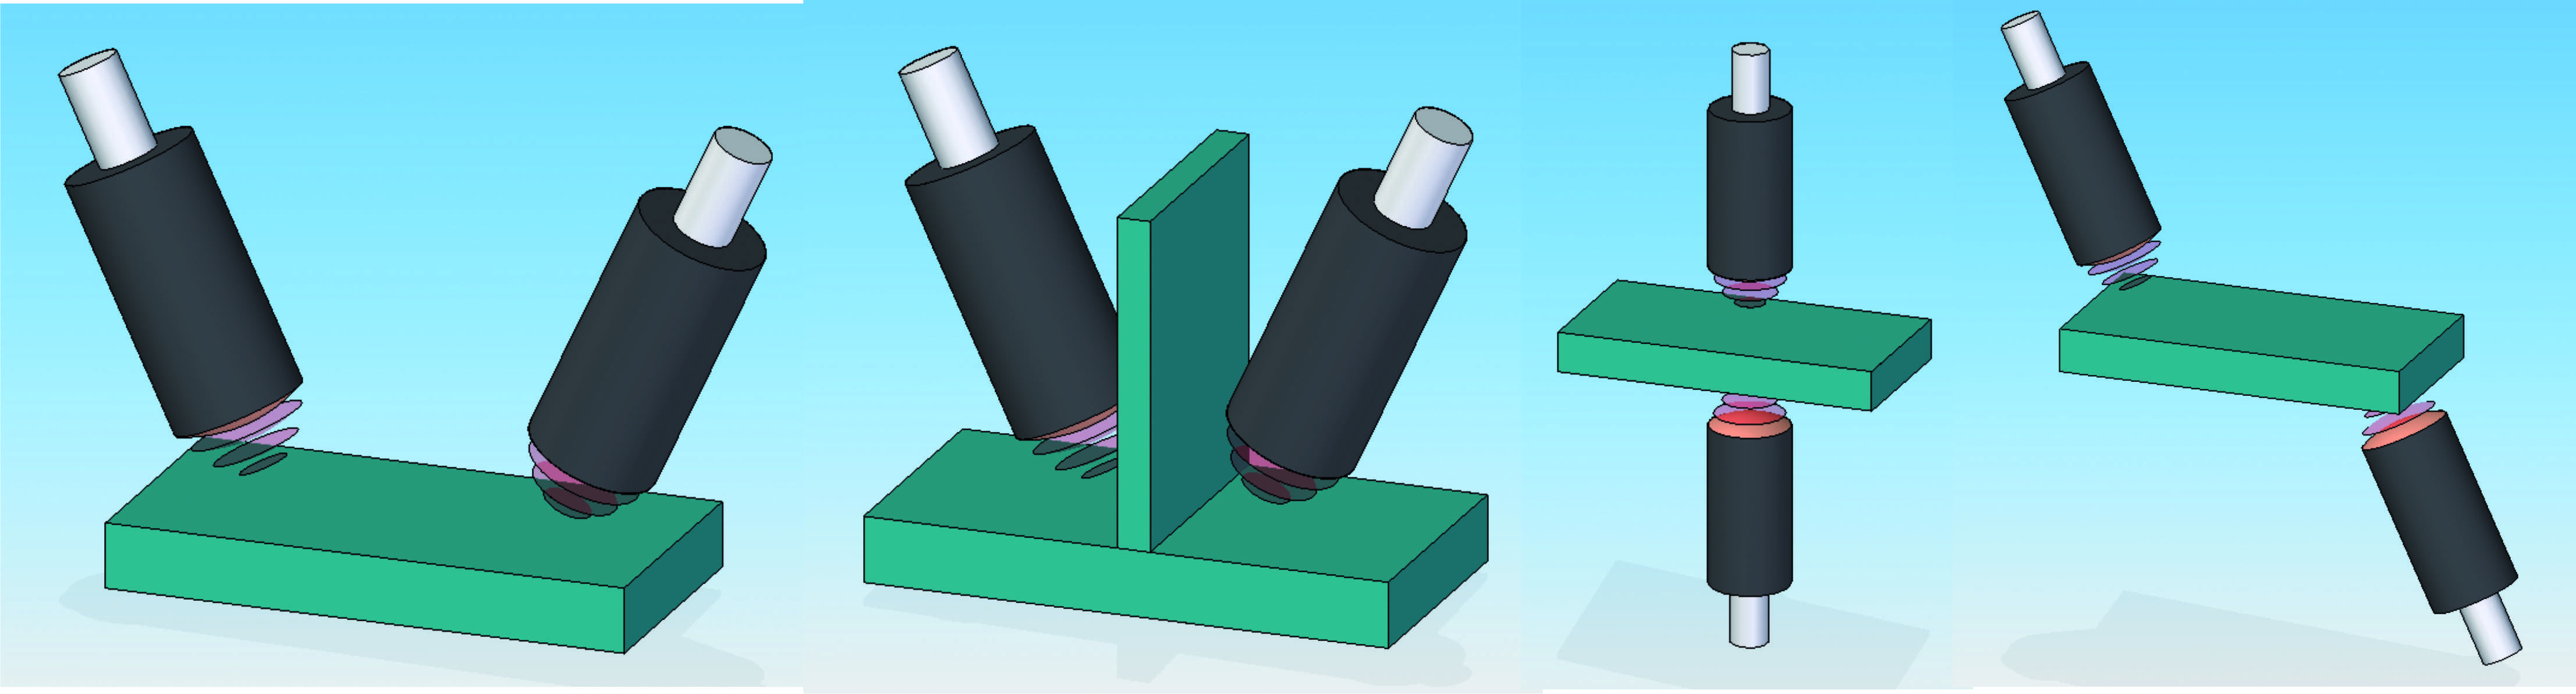
Figure 1 – Several non-contact inspection setups.
|
|
|
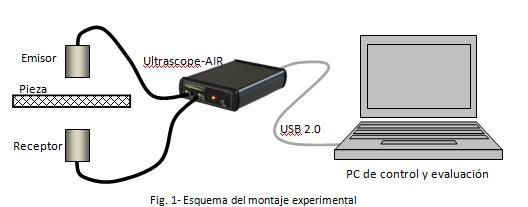
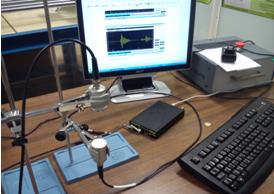
Figure 2 – Typical experimental arrangement for non-contact ultrasound with Ultrascope technology.
A first approach to the problem of non-contact ultrasound inspection.
Measurements in this report intent to estimate the attenuation level with air-borne ultrasound through-transmission technique for several materials and thickness, and to measure the signal-to-noise ratio in each case. Table II at the end of the report resumes the results.
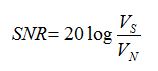
Signal-to-noise ratio (SNR) was estimated by the ratio between the maximum signal amplitude VS and the maximum noise amplitude VN (expressed in dB). Internal reverberations were not considered as noise.
 (1)
(1)
It is important to remark that measurements are not averaged. Even though Ultrascope technology includes hardware implemented average function and an EMI noise reduction filter, they were not used in this work to get the worst case scenario.
For each experiment a different excitation voltage Vp and amplifier gain Gi where applied. For Gi=0 dB, a 100% amplitude signal correspond to a 1V signal, and hence, insertion loss can be calculated by
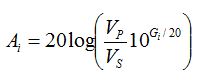 (2)
(2)
To compare results of different experiments, insertion losses were measured relative to a first experiment of direct transmission between transducers (A0):
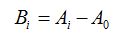
(3)
Fig. 3 shows the received signal in this first experiment, with no part between the transducers.
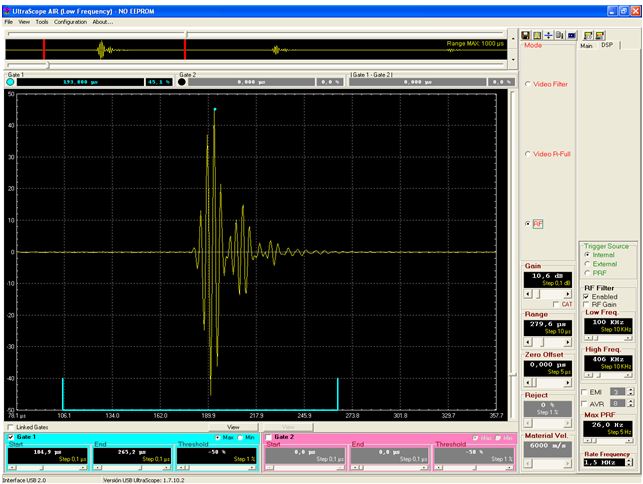
To avoid saturation of the amplifier input due to the large level of the received signal, excitation voltage was reduced to 50V (400V was used in all other experiments). Applied gain was G=10.6 dB and signal amplitude was Vs=0.9V. Signal-to-noise ratio was SNR=60dB and insertion loss A0=45dB (normalized B0=0dB). Table I resumes the parameters used in all experiments.
|
Parameter |
Value |
|
Excitation pulse width |
1,9 µs |
|
Number of excitation pulses |
2 |
|
Excitation amplitude |
400V |
|
Digital filter cutoff frequencies |
100-400 KHz |
|
Sampling frequency |
1.5 MHz |
|
Acquisition mode |
RF |
Description of samples
Sample 1: Carbon-fiber honeycomb of nomex core, with two thicknesses (20 and 27 mm).
Sample 2: Carbon-fiber laminate of 5 mm thickness.
Sample 3: Carbon-fiber honeycomb of aluminum core, with 17mm thickness.
Sample 4: Composite made of carbon-fiber, glass-fiber and polyurethane, with two thicknesses (20 and 65mm).
Sample 5: Solid glass-fiber block with 6 layers and 5mm thickness.
Sample 6: Carbon-fiber laminate of 1mm thickness.
Sample 7: Carbon-fiber laminate of 4mm thickness.
Sample 8: Carbon-fiber laminate of 12mm thickness.
Sample 9: Stainless-steel disc of 10 mm thickness.
Sample 10: Manganese steel block of 30 mm thickness.
Measurement results
Table II resumes the results of each experiment.
|
Nº |
Description |
Gain (dB) |
VS (%) |
VN(*) (%) |
SNR dB |
A dB |
B dB |
|
0 |
Direct transmission through air |
10.6 |
90 |
0.1 |
60 |
45 |
0 |
|
1A |
Carbon-fiber honeycomb of nomex core (20 mm) |
60 |
40 |
10 |
12 |
120 |
75 |
|
1B |
Carbon-fiber honeycomb of nomex core (27 mm) |
60 |
40 |
10 |
12 |
120 |
75 |
|
2 |
Carbon-fiber laminate of 5 mm thickness |
63 |
80 |
1 |
38 |
117 |
72 |
|
3 |
Carbon-fiber honeycomb of aluminum core, with 17mm thickness |
80 |
45 |
9 |
14 |
139 |
94 |
|
4A |
Composite made of carbon-fiber, glass-fiber and polyurethane (20 mm) |
74 |
80 |
4 |
26 |
128 |
83 |
|
4B |
Composite made of carbon-fiber, glass-fiber and polyurethane (65 mm) |
80 |
40 |
10 |
12 |
140 |
95 |
|
5 |
Solid glass-fiber block with 6 layers and 5mm thickness |
65 |
80 |
2 |
32 |
120 |
75 |
|
6 |
Carbon-fiber laminate of 1mm thickness |
62 |
80 |
1 |
38 |
115 |
70 |
|
7 |
Carbon-fiber laminate of 4mm thickness |
80 |
70 |
10 |
17 |
135 |
90 |
|
8 |
Carbon-fiber laminate of 12mm thickness |
68 |
80 |
4 |
26 |
122 |
77 |
|
9 |
Stainless-steel disc of 10 mm thickness |
80 |
50 |
14 |
11 |
138 |
93 |
|
10 |
Manganese steel block of 30 mm thickness. |
80 |
20 |
8 |
8 |
146 |
101 |
(*) Peak noise level measured from the A-Scan.
Discussion and conclusions.
It is worth to mention the large insertion losses obtained, from 115 to 146 dB for different materials. However, insertion loss for direct emission through air is relatively low (45 db), similar to that obtained with wet coupling. This fact is a good indication of the high sensitivity of the developed transducers.
Reflection and transmission coefficients (energy) are:
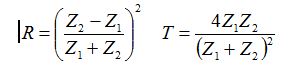 (4)
(4)
Acoustic impedance of air at 20ºC is the product of its density (ρ≈1.2 Kg/m) and the speed of sound (c≈ 343 m/s), being ZAIR≈ 400 Rayls (N·s·m-3).
On the other hand, a CFRP composite has an approximated acoustic impedance of ZCFRP ≈ 5.9 MRayls (ρ≈1.9 g/cm3, c≈3.1 mm/μs). Substituting in (4), for an air-CFRP interface we get R1=0.9997≈1 and T1=2.71e-4≈0, which means practically total reflection. Sound that passes through the material has to cross the CFRP-air interface, with identical coefficients as before. Hence, acoustic impedance mismatch generates total insertion losses of 71 dB. This is the minimum insertion loss expected for CFRP, and it was confirmed experimentally. Moreover, variability reflected in table II can be attributed to internal resonances that can significantly increase or reduce insertion losses.
To the relative insertion losses, other 45 dB must be added because of the acoustic mismatch between the transducer and the air, which gives total insertion losses in the range of 120 dB, confirmed experimentally. This problem is worse when the acoustic impedance of the material is higher than that of the CFRP, like in experiments 9 and 10 (Steel). In those cases, insertion losses are even higher.
Attenuation inside the materials should be also considered. Some construction techniques, like honeycomb, gives ultrasound very thin propagation paths, introducing higher attenuation like in experiment 3. On the other hand, solid laminates give higher propagation area, which is generally associated with lower attenuation values.
Also the manufacturing process has great impact in sound attenuation and insertion losses. For example, the 10 mm thickness CFRP laminate has lower insertion losses than the 4 mm thickness CFRP sample. This fact can be explained by differences in the compacting and curing process.
Besides high attenuation and insertion losses, developed transducers together with an Ultrascope system, where able to obtain a good signal to noise ratio for all samples (between 8 and 38 dB), without averaging received signals.
If the resolution is enough (12mm wavelength in CFRP), it would be possible to detect defects like delaminatios and porosity with a sensitivity better than 6 dB. This will be tested in future works with an automated scanning system.